Your day-ahead look for July 20, 2026
By Omkar Godbole|Edited by Sheldon Reback Jul 20, 2026, 11:15 a.m. 3 min readMake preferred on Share this articleMake preferred on
This is an excerpt from CoinDesk newsletter 'Daybook.' Sign up here, if you haven't already.
Traders may want to keep a close eye on the potential for a bitcoin BTC$64,589.09 "volmageddon,” in other words, a volatility surge that is often accompanied by price declines.
This cautionary outlook is based on the behavior of bitcoin’s 30-day implied volatility index, BVIV. Frequently viewed as the crypto equivalent of Wall Street's VIX, the gauge is influenced by demand for options, the derivative contracts traders use to protect their portfolios from sudden market swings. Generally, the higher the demand for these contracts, the higher the implied volatility and vice versa.
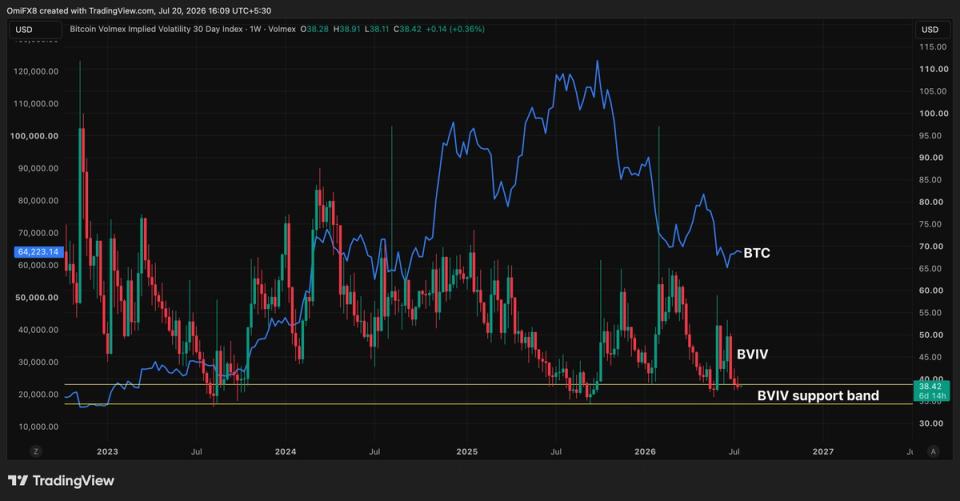
For now, the index is hovering between 34% and 38%, a range that in recent years has been followed by a volatility boom and a price slide (see Today’s signal, below).
For instance, the index reached this zone in late May. What followed was a drop from $74,000 to under $60,000 in less than a week, and an upswing in the BVIV. A similar pattern played out just before the early February crash and during the correction following the record highs reached in October.
While past patterns are never a guarantee of future performance, volatility metrics are widely known to be mean-reverting. This cyclical nature suggests that periods of below-average volatility are often followed by higher turbulence, while above-average volatility paves the way for market stability.
Currently, the index is trading below both its 30-day and 200-day simple moving averages. In essence, volatility is relatively "cheap" and sitting at a historically reliable support zone, suggesting the measure could be set to rise, which means another round of turbulence.
For now, bitcoin continues to trade just above $64,000, maintaining the range-bound price action that has persisted since last Wednesday. While some analysts have noted two consecutive weeks of spot ETF inflows, the capital movement is tiny compared with the billions yanked from the market during the preceding eight-week outflow streak.
Global volatility gauges in traditional markets are currently offering mixed signals. South Korea’s KOSPI VIX is currently above 70%, its highest level since the 1990s. Meanwhile, Wall Street’s VIX jumped over 12% to reach 18% on Friday, where it continues to hover. However, these levels have been in the play for months, which means that stocks are anything but panicked.
Additionally, the MOVE index, the 30-day volatility gauge for U.S. Treasury notes that underpins global finance, remains steady around 70%, as it has since April, offering a constructive cue for risk assets. Stay alert!
Read more: For analysis of today's activity in altcoins and derivatives, see Crypto Markets Today . For a comprehensive list of events this week, see CoinDesk's "Crypto Week Ahead."
What’s trending
- Moonshot AI IPO push follows Kimi, Alibaba AI releases that shook bitcoin (CoinDesk): Moonshot AI is preparing to go public within six months, moving to tap capital markets days after its Kimi K3 model upended assumptions about how far behind China's AI sector really is.
- Oil prices erase gains after Iran says U.S. talks could be pursued based on national interests (CNBC): Oil prices were mixed on Monday, erasing gains after Iran said negotiations with the U.S. could be pursued based on national interests. Brent crude was at $88.14 and West Texas Intermediate, $82.08.
- U.S. strikes Iran for ninth day; Iran says two oil tankers in Strait of Hormuz exploded and immobilised (Reuters): U.S. forces hit Iran for a ninth consecutive day on Monday as concerns grew over shipping through the Strait of Hormuz after Iran said two oil tankers had exploded and been immobilized.
- Amazon Japan supplier AZ-Com Maruwa to adopt yen stablecoin JPYC for payments (CoinDesk): AZ-COM Maruwa Holdings (9090), a distributor whose clients include Amazon Japan, plans to use the yen stablecoin JPYC for fees and other payments to its network of around 2,300 partners, including subcontractors and truck drivers.
Today’s signal
The chart shows bitcoin’s price swings (blue line) and changes in bitcoin’s 30-day implied volatility index (BVIV) in candlestick format.
Over time, BVIV has established a support range in the 34%–38% area, and each drop into this zone has tended to precede fresh bouts of market turbulence and bitcoin price weakness.
At present, BVIV is hovering around 38%, close to the upper edge of that range.
Crypto Daybook AmericasRelated AssetsBitcoin$64,589.090.27% Latest Crypto News
 Latest Research
Gate Leads Spot Market Share Gains as CEX Volumes Rise for First Time in Five Months
Gate Leads Spot Market Share Gains as CEX Volumes Rise for First Time in Five Months
CEX trading volumes rose for the first time in five months in June, with spot climbing 15.3% to $1.11T and RWA perpetual volumes surging to a record $311B.
By CoinDesk ResearchJul 13, 2026CEX trading volumes rose for the first time in five months in June, with spot climbing 15.3% to $1.11T and RWA perpetual volumes surging to a record $311B.
Why it matters:
CEX trading volumes rose for the first time in five months in June, with spot climbing 15.3% to $1.11T and RWA perpetual volumes surging to a record $311B.
View Full ReportMore From Crypto Daybook Americas
Yorumlar (0)
Giriş yaparak yorum yazabilirsin.
İlk yorumu sen yaz.